
A colleague of mine approached me about an ArtNet file I had given him that was a simple 10-second fade of a Green LED on a light fixture. He put a spectrometer on the fixture and measured the light's output from the 10-second fade. It showed a pattern that was not linear.
The file was a recording made via ArtNet out of my console.
Cue 1 = Blue and Green LEDs at full
Cue 2 = Green LED fade to 0 over 10 seconds.
He did a deeper dive into the DMX data that is output from EOS 3.2.5 (Gio@5), took the recorded ArtNet data an imported it into a spreadsheet.
What we see is that the DMX output is not linear during the fade, and is the same pattern seen by the spectrometer on the light's output.
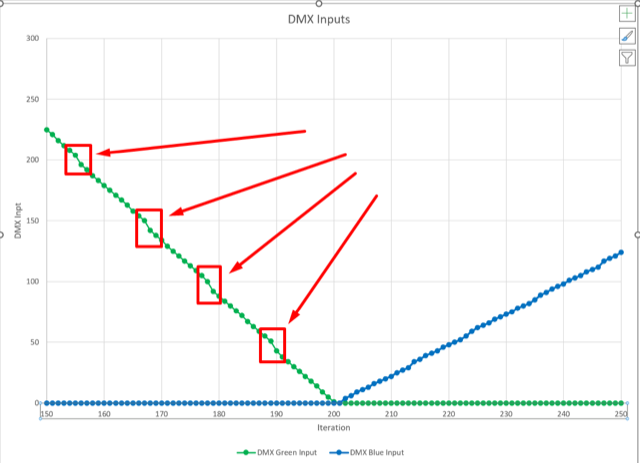
This graph is generated from the spreadsheet of the DMX data.
Shouldn't this fade be linear? What is the jumping pattern about every 12 steps that has a delta 2x larger than the rest of the steps?
Here is an empty show file with the fixture patched and the Cues above in Cue List 1. Fixture is a Litepanels Gemini profile S06 (same dmx layout as a Skypanel Mode 6)
Gemini Fade - Mode S06 - ArtNet - Empty Show 2023.esf3d
And here's the spreadsheet of the data from the fade file (need to open in Excel) recorded from the EOS output.
The tab labeled Chart 1 = spectrometer reading of the light's output where this pattern was noticed
The tab labeled DMXvsDIM: Look at row 421 thru 821 in Column M. Those are the DMX values you see in the graph above (green line & dots)
In that same tab, Column N is the delta between the steps. Why is this not linear? My assumption is that it should be.

