Visualizing Absolute Effects -- Are these correct?

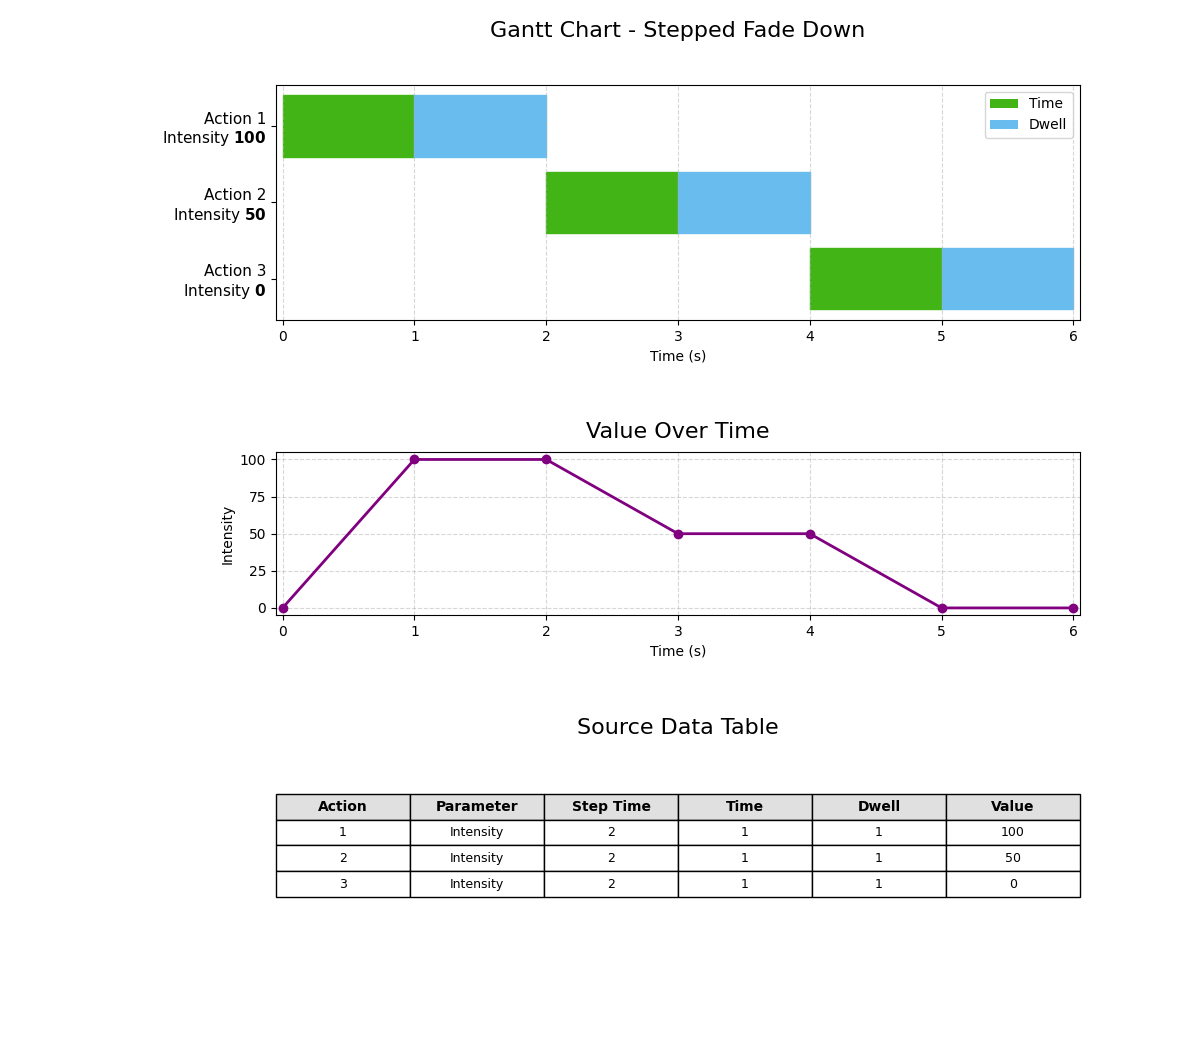
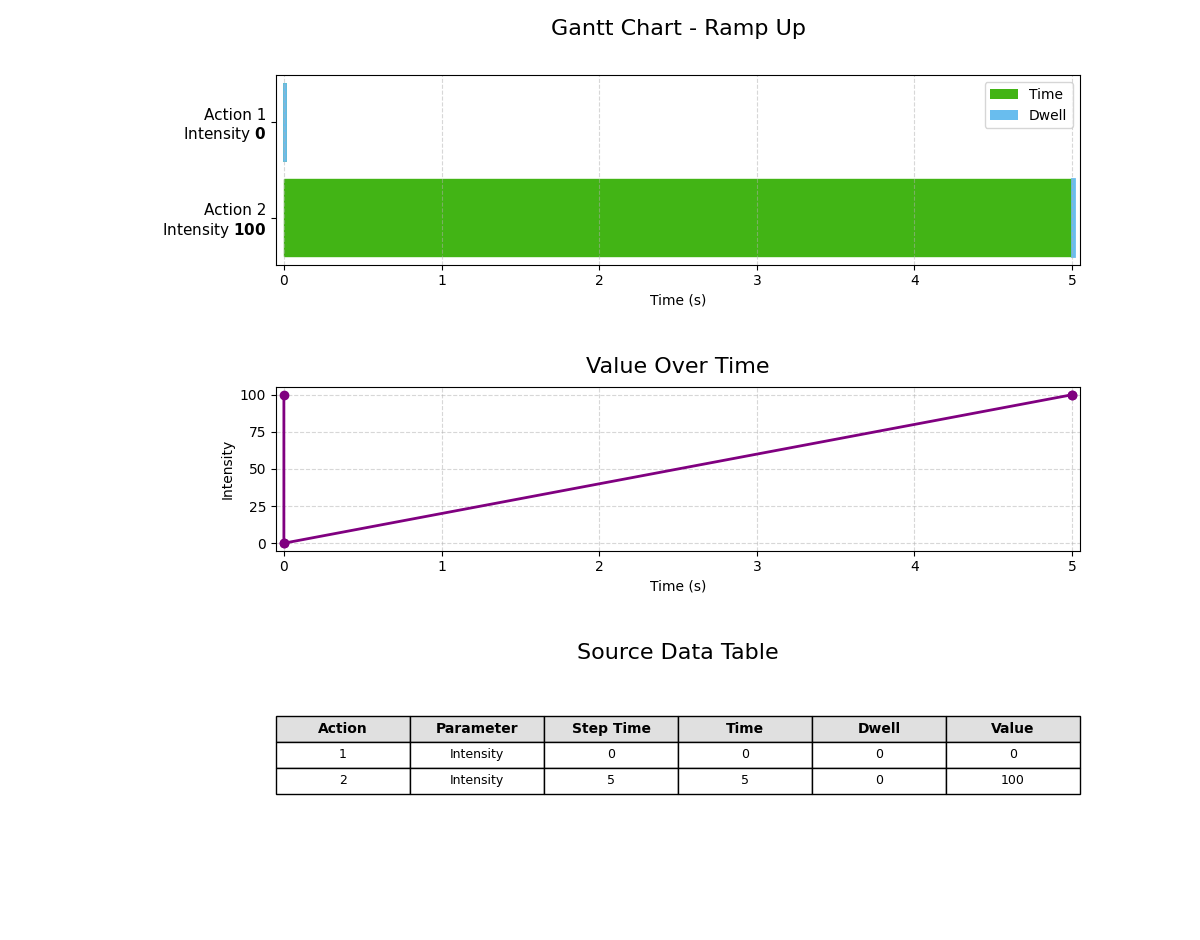
I am a visual learner, so I wrote a python script that takes the actions from a absolute effect and plots them as gantt and line charts.  Before I do more and support things like manual step times, I wanted to make sure I'm on the right track.  I'm very new to EOS and digital boards in general, so I want to make sure my current understanding matches reality.  Here's the first two I did so far with just one parameter.  Thanks so much!

Parents
  • Yep they look right. 
    There are lots of things that can change the look on stage. Remember effects will act on the Chanel selection order. So if 1 thru 10 is selected the effect will act on ch 1 then 2 then 3 and so on. Where as if you select 10 thru 1 the opposite is true.

    Work through the training books and videos with the capture visualiser file and then you can see what is happening as you do it

    happy playing……I mean learning!

    Regards

    Geoff

Reply
  • Yep they look right. 
    There are lots of things that can change the look on stage. Remember effects will act on the Chanel selection order. So if 1 thru 10 is selected the effect will act on ch 1 then 2 then 3 and so on. Where as if you select 10 thru 1 the opposite is true.

    Work through the training books and videos with the capture visualiser file and then you can see what is happening as you do it

    happy playing……I mean learning!

    Regards

    Geoff

Children
No Data
Related